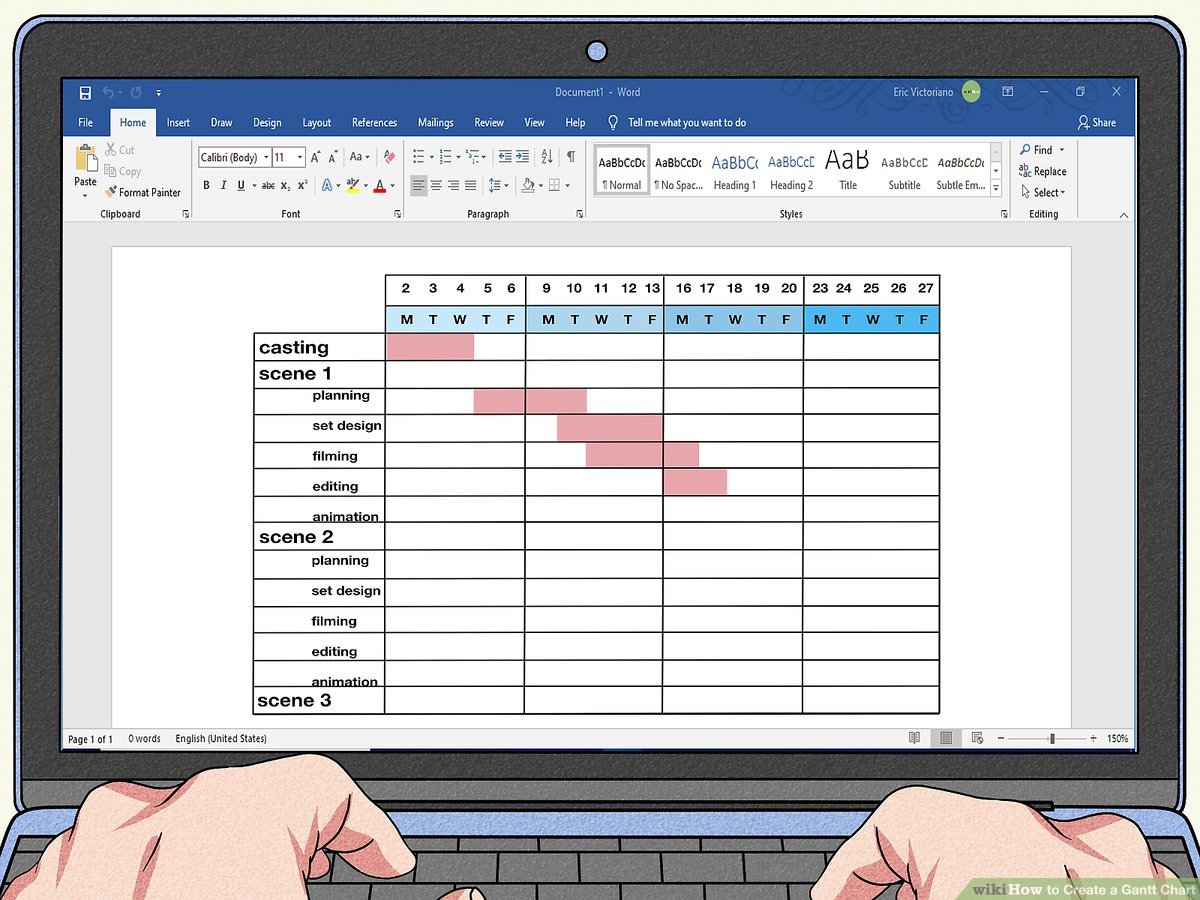
For project management, you may think that you need dedicated software like Microsoft Project to create professional Gantt charts, but you can actually create Gantt charts in Excel as well.
Let us look at two ways to create a Gantt chart in Excel.
1. How to Create a Gantt Chart in Excel
There are three main steps to creating a Gantt chart from scratch in Excel: Create a project table, create a stacked bar chart, and adjust that bar chart to the Gantt chart.
Let us see the details of each step one by one.
Step 1: Create a Project Table
Your project table will have a simple description of your tasks, with an estimated duration in days required to complete and a start date for each task.
Once you’ve created your project table, let’s move on to creating a stacked bar chart.
Step 2: Create a Stacked Bar Chart
Select your table category. Do not include the title of the table in your selection. Also, make sure that there is no title for the task list. In the above example, the table range is A2:C9.
As you can see, the resulting chart doesn’t look like a Gantt chart anymore. You have to make some changes.
Next, let’s format the dates correctly. Currently, the X-axis shows another starting date. You want this date to be the same as the start date of your first job.
Type the first job start date in Minimum and the last job end date in Maximum. Excel will automatically convert your dates to the necessary figures to accommodate the chart.
Under the Units sub-section, set Major to 7. This way, your chart displays only one weekly date.
By now, your Gantt chart is pretty much complete. The last thing you need to do is enter a chart title for your Gantt chart. Also, select the legend below and press Delete on your keyboard.
That’s all! This is how to create a Gantt chart in Excel.
2. How to Create a Gantt Chart Using Templates in Excel
If you have a large project with lots of tasks, one option is to use a Gantt chart template. These templates already have the necessary formulas in place. The designs also help you break down your tasks into different categories, so you have a better view of the big picture.
There are various Gantt chart templates in Excel for your needs. Once you select a template, Excel will open a new document with the entire template in the worksheet. Then, fill in your tasks and their respective dates in the relevant cells. Be careful not to tamper with formulas when you key your data.
Create a Gantt Chart in Excel to Track Your Projects
You can manage your projects by creating a Gantt chart in Excel. If this is a small, one-time event, you can create a simple Gantt chart using the first method discussed above.
If it’s a more complex, detailed project, you may find that Gantt chart templates are more appropriate. Besides Excel, there are other software that you can use to create Gantt charts as well.

